Quant Analyzer Report
Pamm Building Dreams
| Symbol | Portfolio | Period | 01.01.2007 - 29.01.2016 |
|---|---|---|---|
| Initial deposit | 2000.0 | ||
| Parameters | 0.02 Fixed Lot | ||
Total Profit
20071.5 €
Profit in pips
183414.6 pips
Yrly Avg profit
2209.72 €
Yrly Avg % ret
110.49 %
CAGR
27.14 %
# of trades
17126
Sharpe ratio
0.11
Profit factor
2.12
Return / DD ratio
86.66
Winning %
69.62 %
Drawdown
231.61 €
% Drawdown
7.3 %
Daily Avg profit
6.92 €
Mthly Avg profit
184.14 €
Average trade
3.26 €
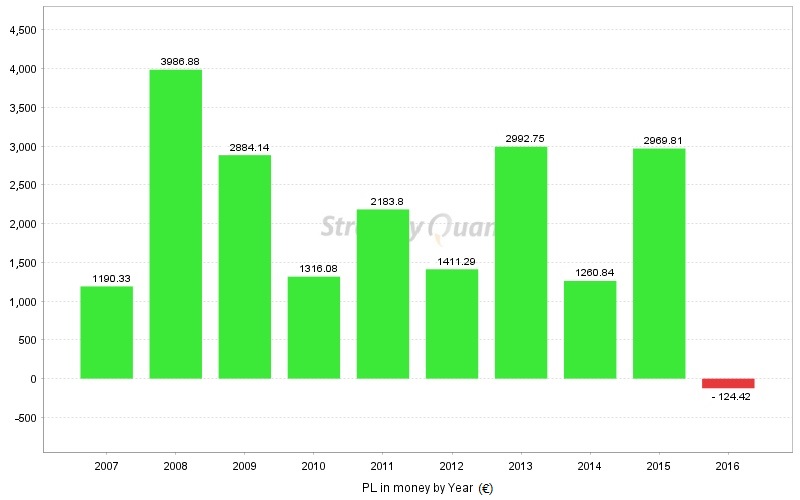
Monthly Performance (€)
| Year | Jan | Feb | Mar | Apr | May | Jun | Jul | Aug | Sep | Oct | Nov | Dec | YTD |
| 2016 | -124.42 | 0 | 0 | 0 | 0 | 0 | 0 | 0 | 0 | 0 | 0 | 0 | -124.42 |
| 2015 | 432.99 | 335.4 | 634.94 | 184.77 | 319.78 | 262.18 | 82.79 | 171.43 | 93.64 | 87.83 | 69.34 | 308.75 | 2983.84 |
| 2014 | 143.26 | 43.54 | 189.98 | 37.26 | 91.28 | 128.06 | -6.52 | 19.54 | 277.01 | 260.87 | 89.1 | -26.57 | 1246.81 |
| 2013 | 135.59 | 459.64 | 125.57 | 387.28 | 126.15 | 663.11 | 282.34 | 179.63 | 372.84 | 55.05 | 152.08 | 53.47 | 2992.75 |
| 2012 | 161.65 | 173.11 | 147.12 | 75.68 | 32.28 | 99.71 | 232.39 | 167.38 | 151.45 | 0.68 | 102.66 | 68.29 | 1412.4 |
| 2011 | 210.16 | 115.65 | 148.21 | 101.16 | 279.12 | 162.2 | 245.38 | 65.81 | 447.42 | 45.3 | 170.22 | 192.06 | 2182.69 |
| 2010 | 122.87 | 118.01 | 21.42 | 4.71 | 305.25 | 188.79 | 34.56 | 81.27 | 187.78 | 64.5 | 260.86 | -73.94 | 1316.08 |
| 2009 | 121.03 | 218.03 | 887.9 | 80.43 | 130.75 | 89.91 | 21.78 | 246.37 | 292.92 | 344.46 | 153.63 | 316.05 | 2903.26 |
| 2008 | -8 | 374.59 | 254.56 | 150.73 | 178.44 | 223.55 | 90.33 | 605.45 | 327.59 | 901.51 | 497.91 | 371.1 | 3967.76 |
| 2007 | 117.42 | 89.71 | -21.34 | -0.12 | 26.51 | 119.89 | 130.5 | 67.34 | 105.37 | -93.48 | 331.89 | 316.64 | 1190.33 |
Stats
Strategy
| Wins/Losses Ratio | 2.29 | Payout Ratio (Avg Win/Loss) | 0.93 | Average # of Bars in Trade | 0 |
| AHPR | 0.01 | Z-Score | -26.32 | Z-Probability | 0 % |
| Expectancy | 1.17 | Deviation | 5.83 € | Exposure | -999999999 % |
| Stagnation in Days | 84 | Stagnation in % | 2.53 % |
Trades
| # of Wins | 11923 | # of Losses | 5203 | # of Cancelled/Expired | 0 | ||
| Gross Profit | 37948.27 € | Gross Loss | -17876.77 € | Average Win | 3.18 € | Average Loss | -3.44 € |
| Largest Win | 77.63 € | Largest Loss | -44.42 € | Max Consec Wins | 42 | Max Consec Losses | 18 |
| Avg Consec Wins | 4.38 | Avg Consec Loss | 1.91 | Avg # of Bars in Wins | 0 | Avg # of Bars in Losses | 0 |
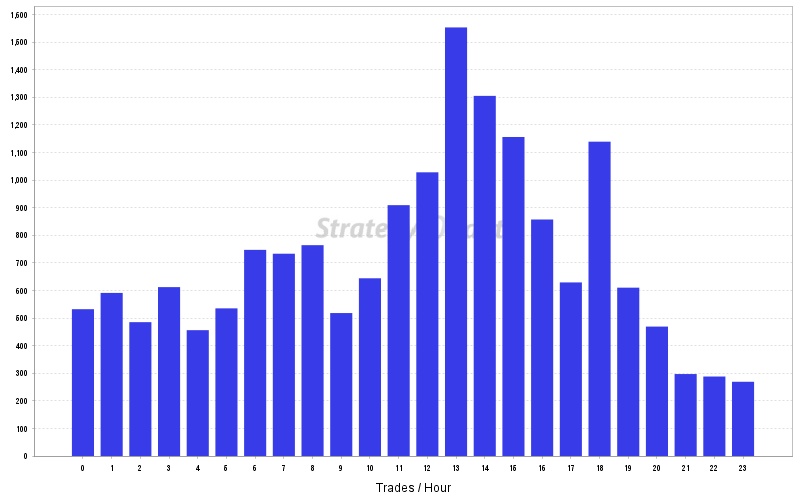
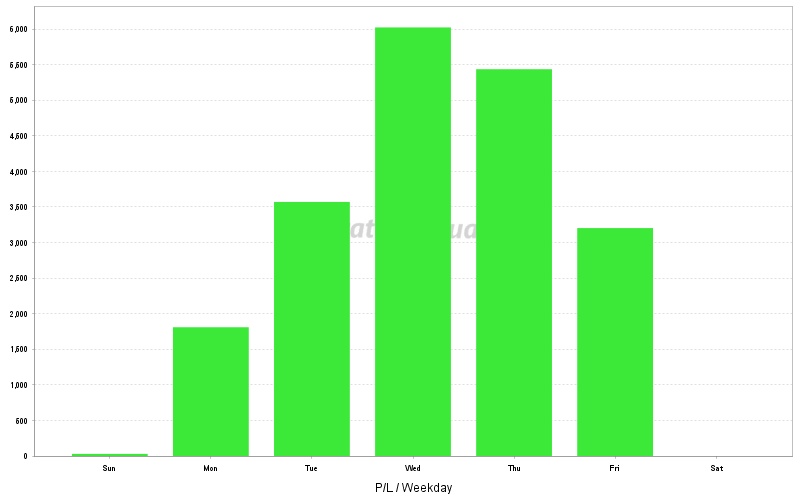
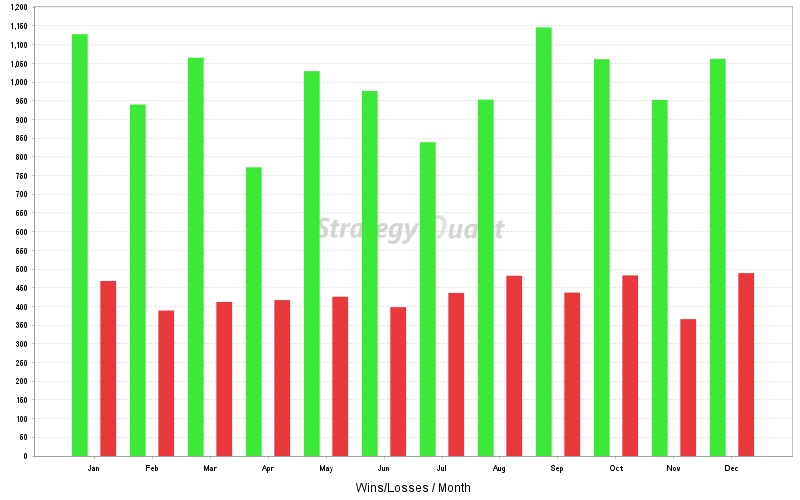
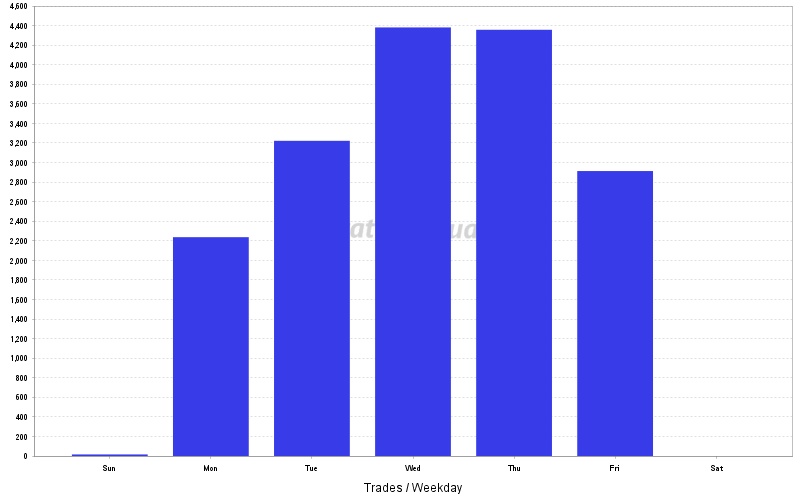
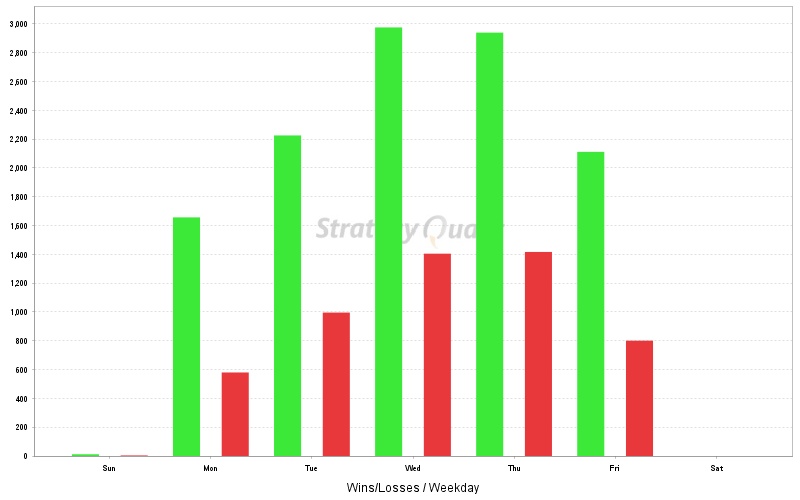
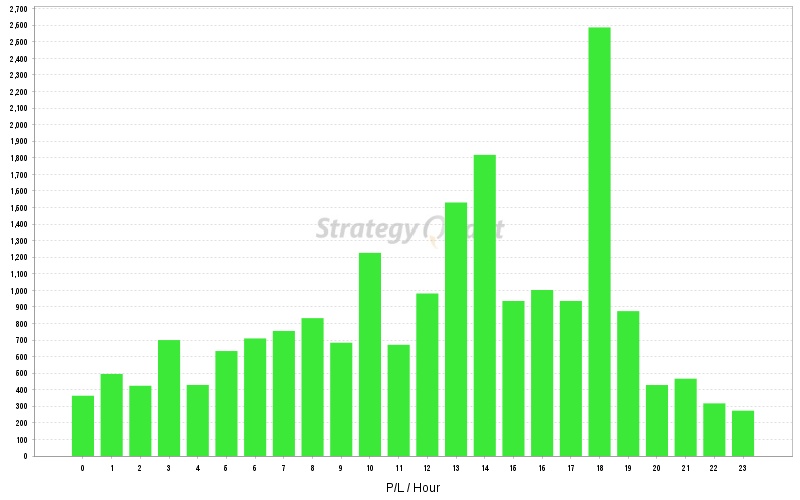
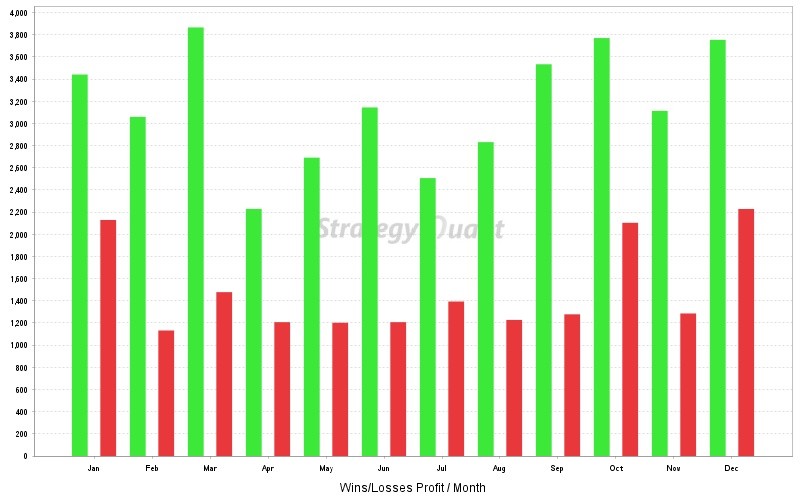
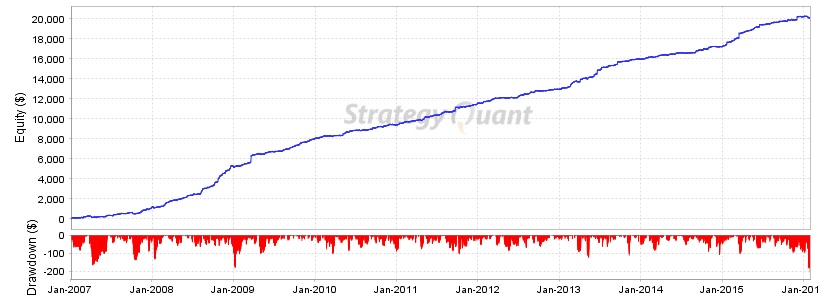
Charts
Click on the chart to see bigger image